Marker detection
- Student: Balthazar Neveu
- Master MVA, Introduction to geoscience
Raw data captures
- Depth
- Gamma rays (clampped numerical outliers to zero).
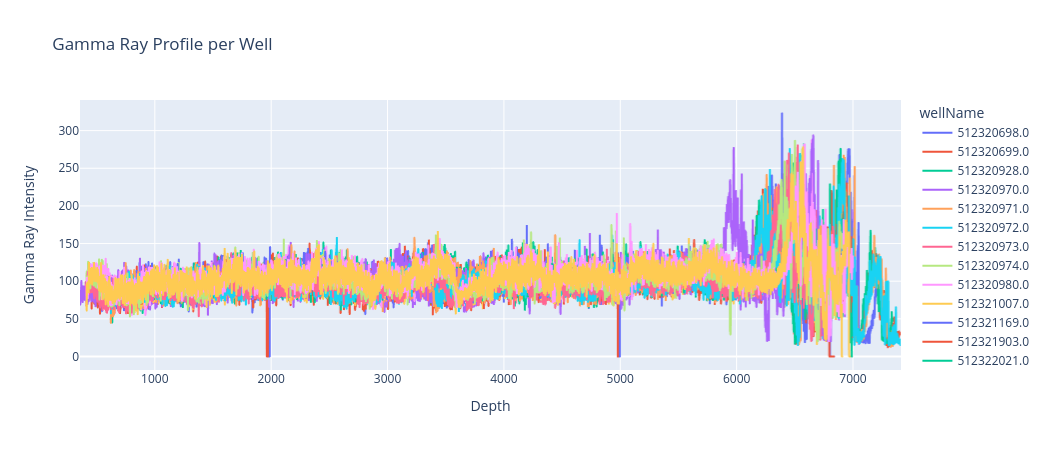
- Most of the big "variations" occur in very deep areas (6-7km).
- Looks like most of the shallow signals is just noise. Characteristics?
Characteristics
- Noise
- Regular sampling rate
- Spikes = outliers
- Missing data.
Curation alternatives (pre-processing):
- 🎯 interpolate missing data (spikes)
- 💡 Denoise (bilateral or bandpass?)
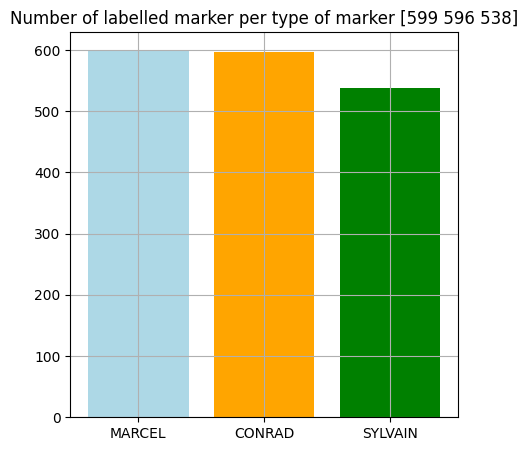
Labelled data exploration
- Data has been labeled by experts. We know the depth of 3 types of events.
- Labels are sometimes missing (⚠️ depth=
NaN).
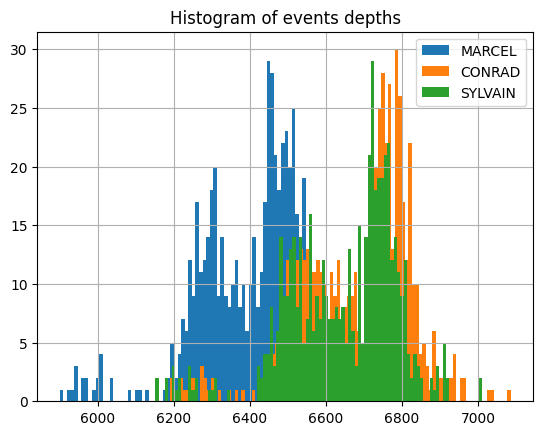
Depth exploration
| Absolute depths | Relative depths |
|---|---|
 |
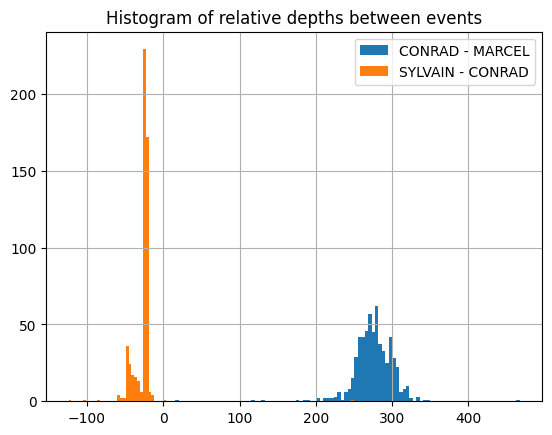 |
| It seems like we observe the same depth histogram basically 3 times with an offset. If there is a relationship between the 3 depths, we should be able to see it on the 2 histograms of differences | Looks like if we find one of the events, we almost know where the search the other ones from the distribution. Estimating jointly the 3 events with a prior on their relative depths sounds like a good idea. |
- The events we're looking for are located between 6 to 7 km.
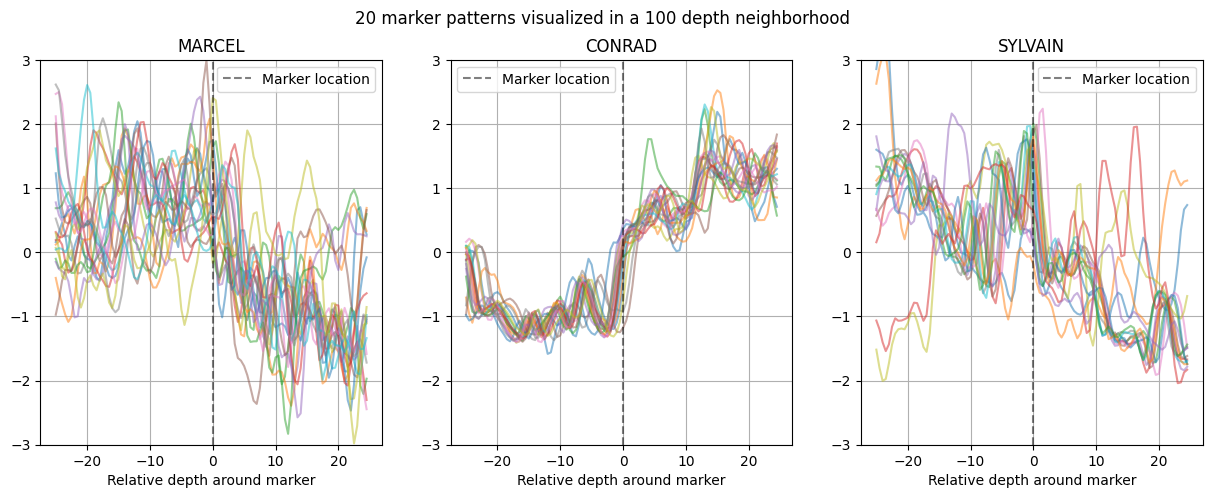
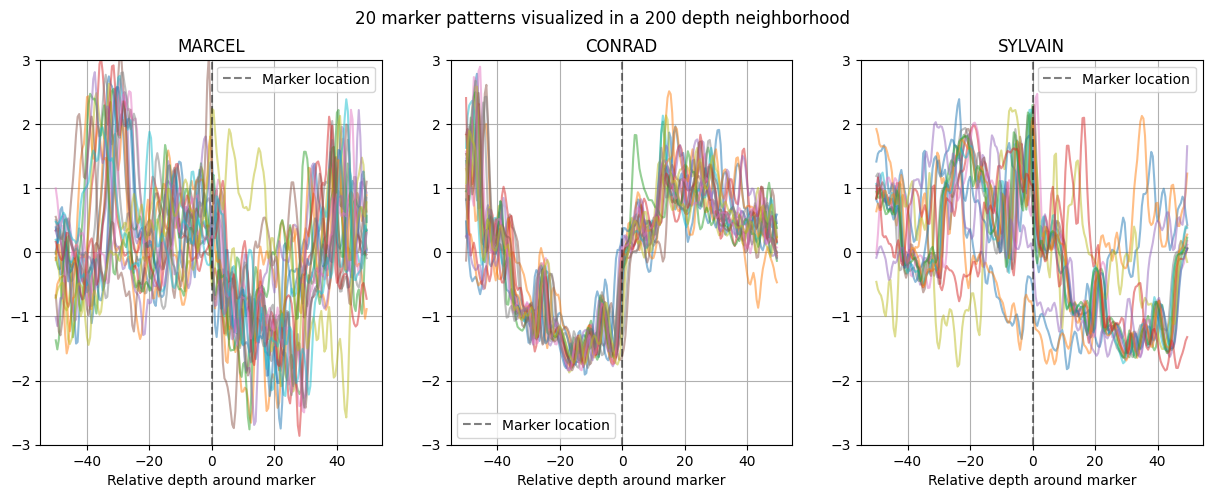
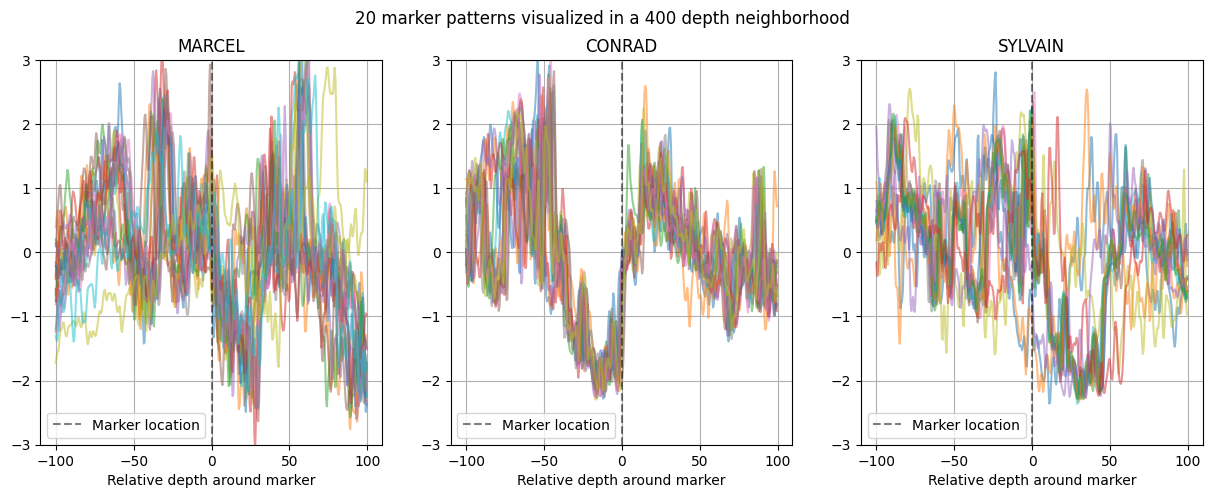
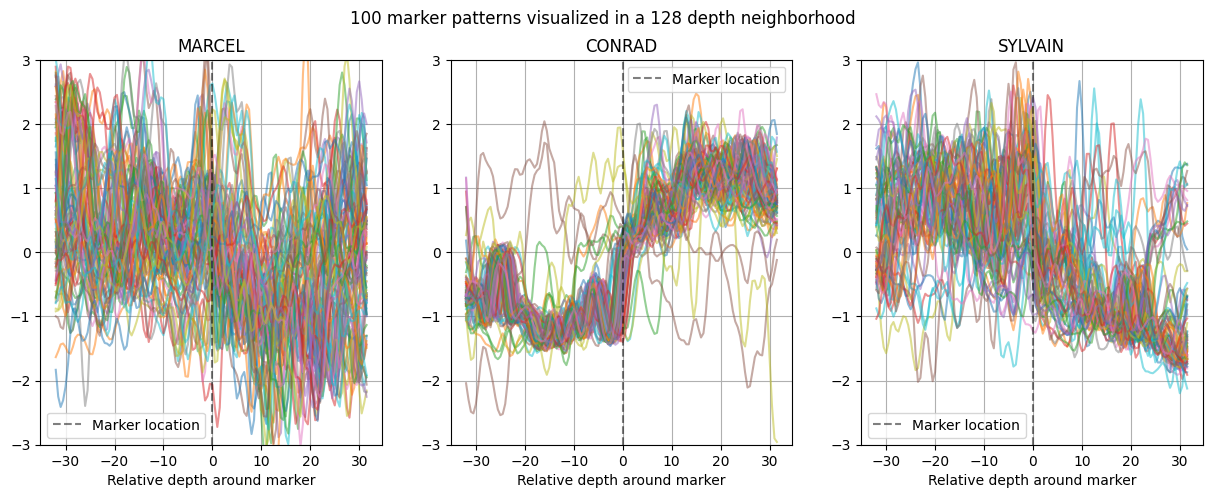
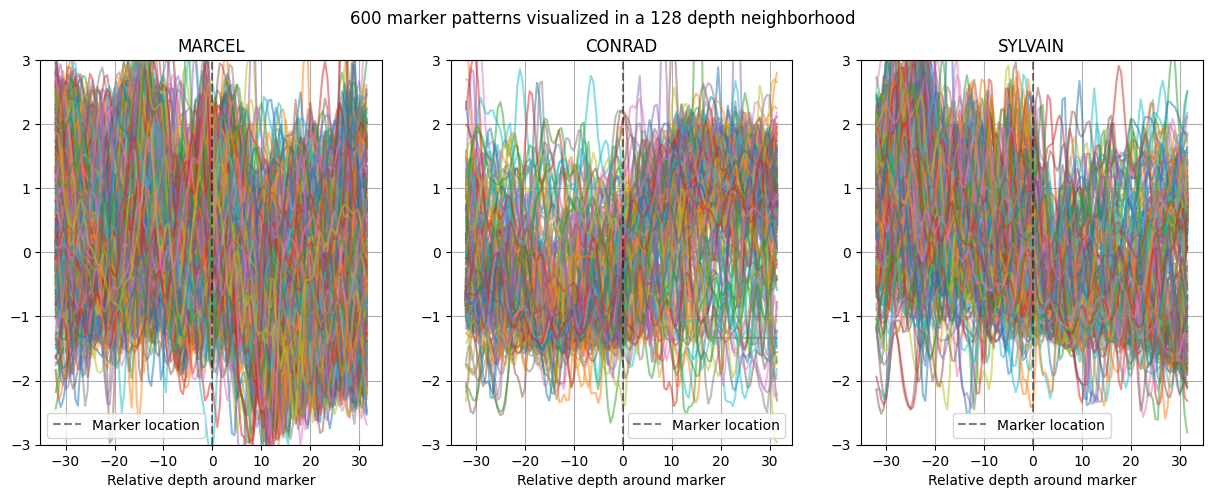
Patterns exploration
| 100 | 200 | 400 |
|---|---|---|
 |
 |
 |
neighborhood 100
neighborhood 200
neighborhood 400
neighborhood 64 - 100 samples
neighborhood 64 - all samples
Templates extraction
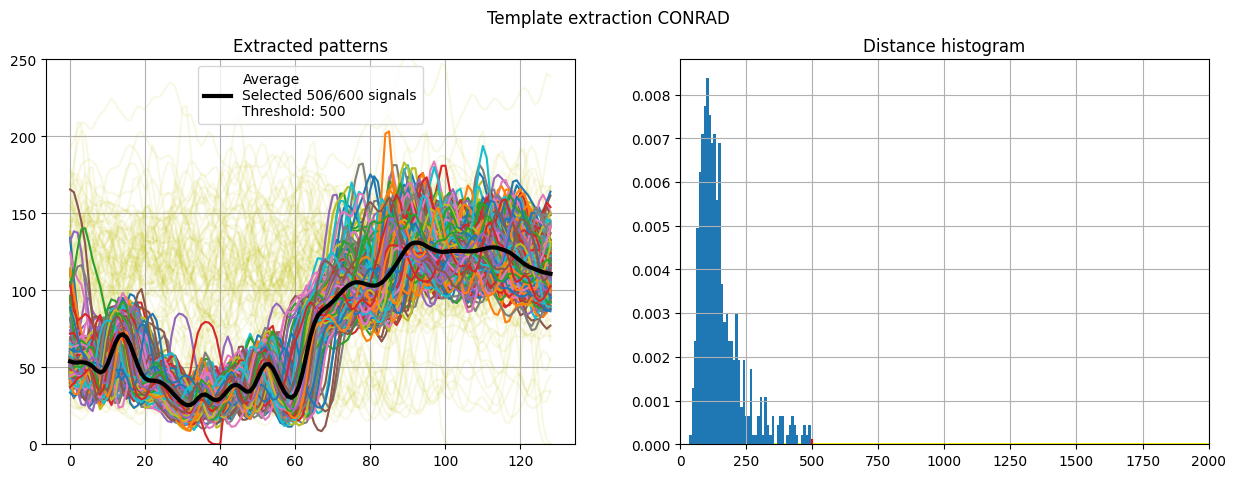
- Many other markers cannot be explained by this first major template.
- More templates shall be extracted (proceed by iterative elimination).
Template retrieval
- Find best match between template and full log signals.
- Find shift which minimizes L2 cost function ~ maximize correlation.
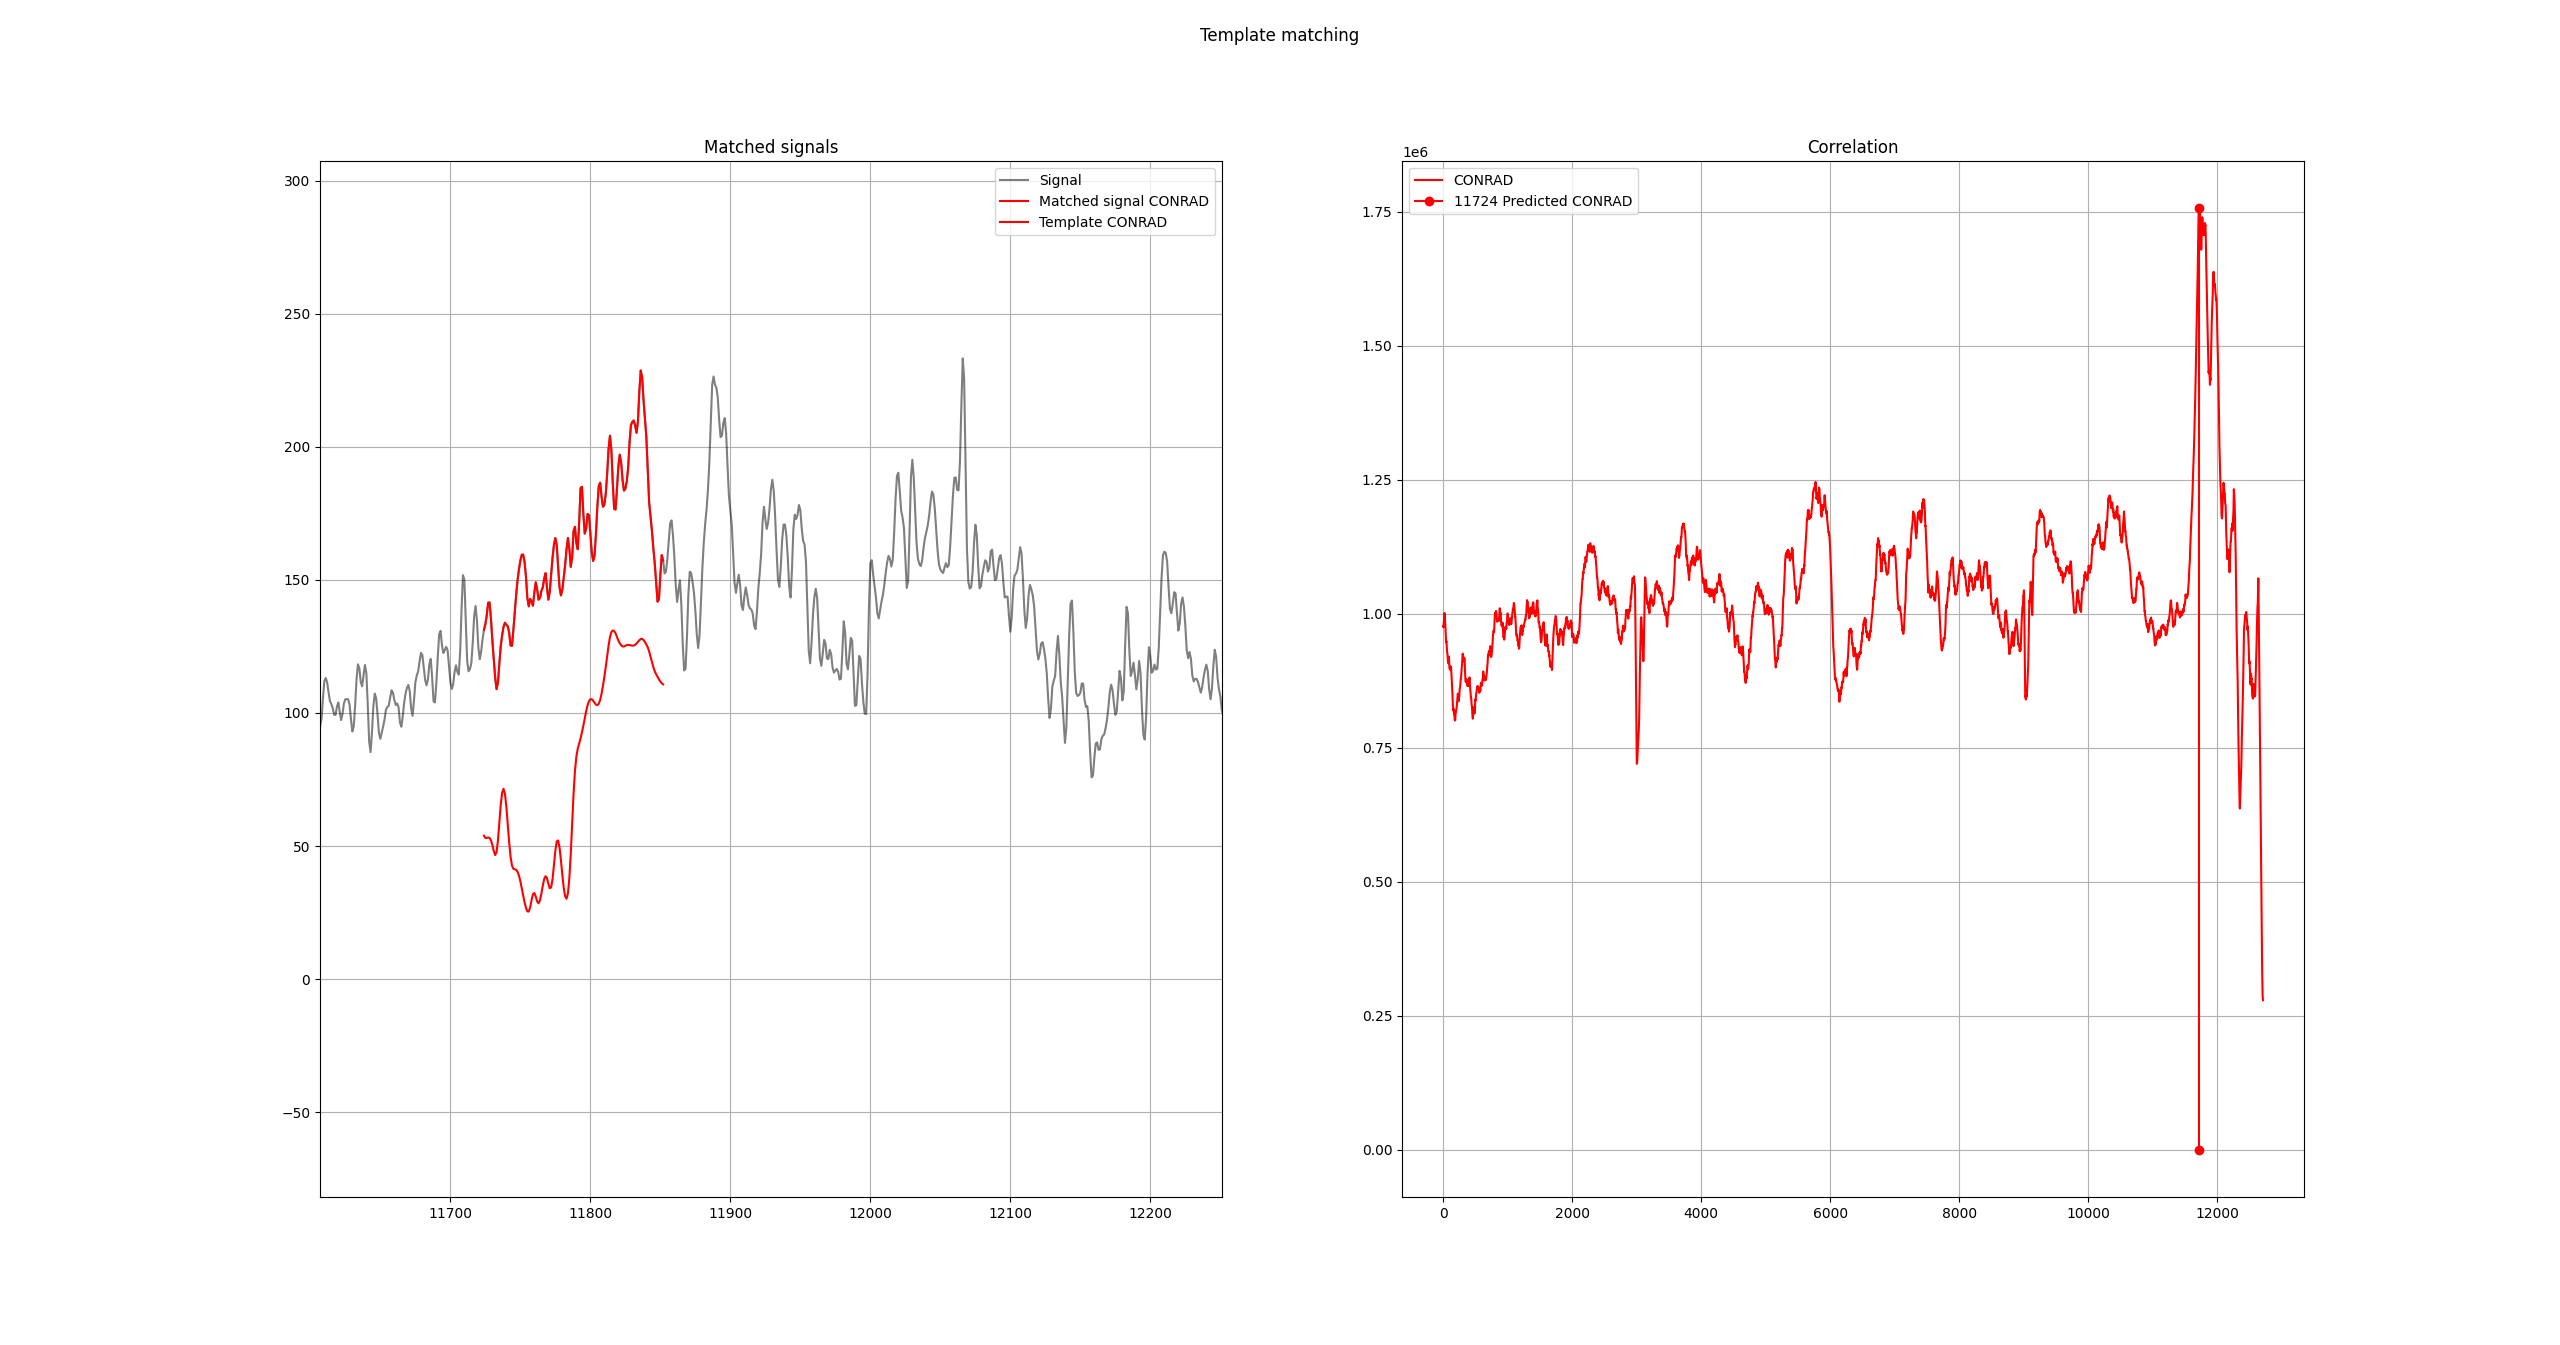
- One should normalize the Euclidian distance. omitted due to lack of time