interactive_pipe
Turn plain python processing functions into an interactive GUI app — without writing a single line of GUI code.
pip install interactive-pipe
- Develop an algorithm while debugging visually with plots, checking robustness and continuity to parameter changes.
- Magically create a graphical interface to demonstrate a concept or tune your algorithm.
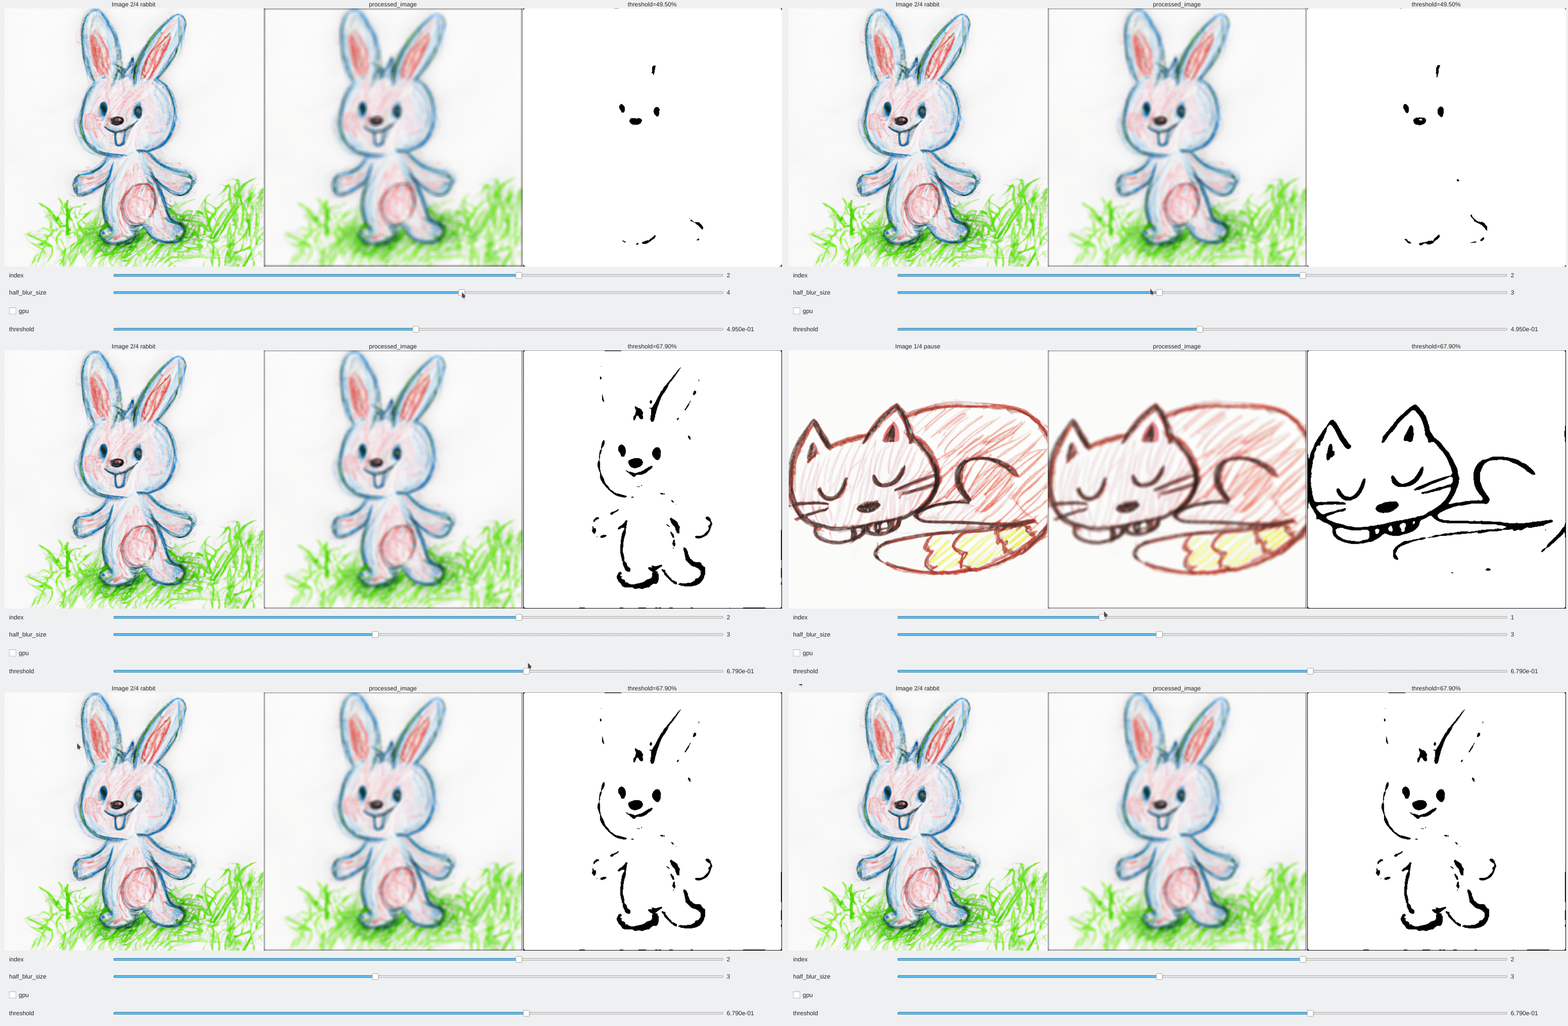
How it works
Decorate your processing functions with @interactive() to declare which keyword arguments become sliders, checkboxes or dropdowns. Chain them in a pipeline function decorated with @interactive_pipeline(gui="qt"). Calling the pipeline opens the GUI.
from interactive_pipe import interactive, interactive_pipeline
import numpy as np

@interactive(coeff=(1.0, [0.5, 2.0], "exposure"))
def exposure(img, coeff=1.0):
    return img * coeff

@interactive_pipeline(gui="qt")
def my_pipeline(img):
    exposed = exposure(img)
    return exposed

my_pipeline(np.array([0.0, 0.5, 0.8]) * np.ones((256, 512, 3)))
Head to the Quickstart for the full walkthrough, the decorators guide, or the API reference.
Who is this for?
🎓 Scientific education
- Demonstrate concepts by interacting with curves and images.
- Easy integration in Jupyter notebooks (works on Google Colab).
🎁 DIY hobbyists
- The declarative style makes a graphical interface in a few lines of code.
- For instance: a jukebox for a toddler on a Raspberry Pi.
📷 Engineering (computer vision, image/signal processing)
- Make small experiments with visual checks while prototyping an algorithm or testing a neural network — and share a demo anyone on your team can play with.
- Tune your algorithms with a GUI and save parameters for later batch processing.
- The processing engine also runs without a GUI (headless), so the same code serves tuning and batch processing.
- Keep your algorithm library untouched: interactivity is added by decoration, not by rewriting.
Features
- Modular multi-image processing filters with a declarative GUI: sliders, checkboxes, dropdowns, text prompts, image buttons, circular sliders.
- Four backends: Qt, matplotlib, Jupyter widgets (
nb), Gradio — plus headless mode (backend matrix). - Caching of intermediate results in RAM for much faster interaction.
KeyboardControl: update values on key press instead of a slider.- Curve plots (2D signals), table outputs and audio support.
TimeControl: play/pause an incrementing timer for animations.- Context API: share state across filters via the
contextandeventsproxies; arrange the display withlayout. - Panel system: group controls into nested, collapsible, detachable panels.
- MIT license.
Agent-friendly docs
Coding agents can fetch the whole documentation in one shot:
llms.txt— curated indexllms-full.txt— full documentation, including the API reference